Operational SLA monitoring software for service teams.

SLApulse gives every SLA an operational state: stable, under watch, at risk, or critical. Service and Jira teams get a practical workspace for deciding what to do next.

SLApulse Command Center showing the fictional DEMO project card, readiness state, operational counts and next action
Screenshot from SLApulse — demo data. Command Center brings the portfolio's next SLA decisions together.

Five views, one operating rhythm

Each view answers a practical question: where to focus, what is changing, what needs action, how to explain the result, and how to keep the workspace ready.

1 · Start with the portfolio

Command Center

What you see
Each project’s readiness, operational counts, measured compliance and next action in one portfolio view.
Decision it supports
Choose whether a project needs setup attention, an operational check or a report review.
Use it when
You are planning the day or checking where the team should focus first.
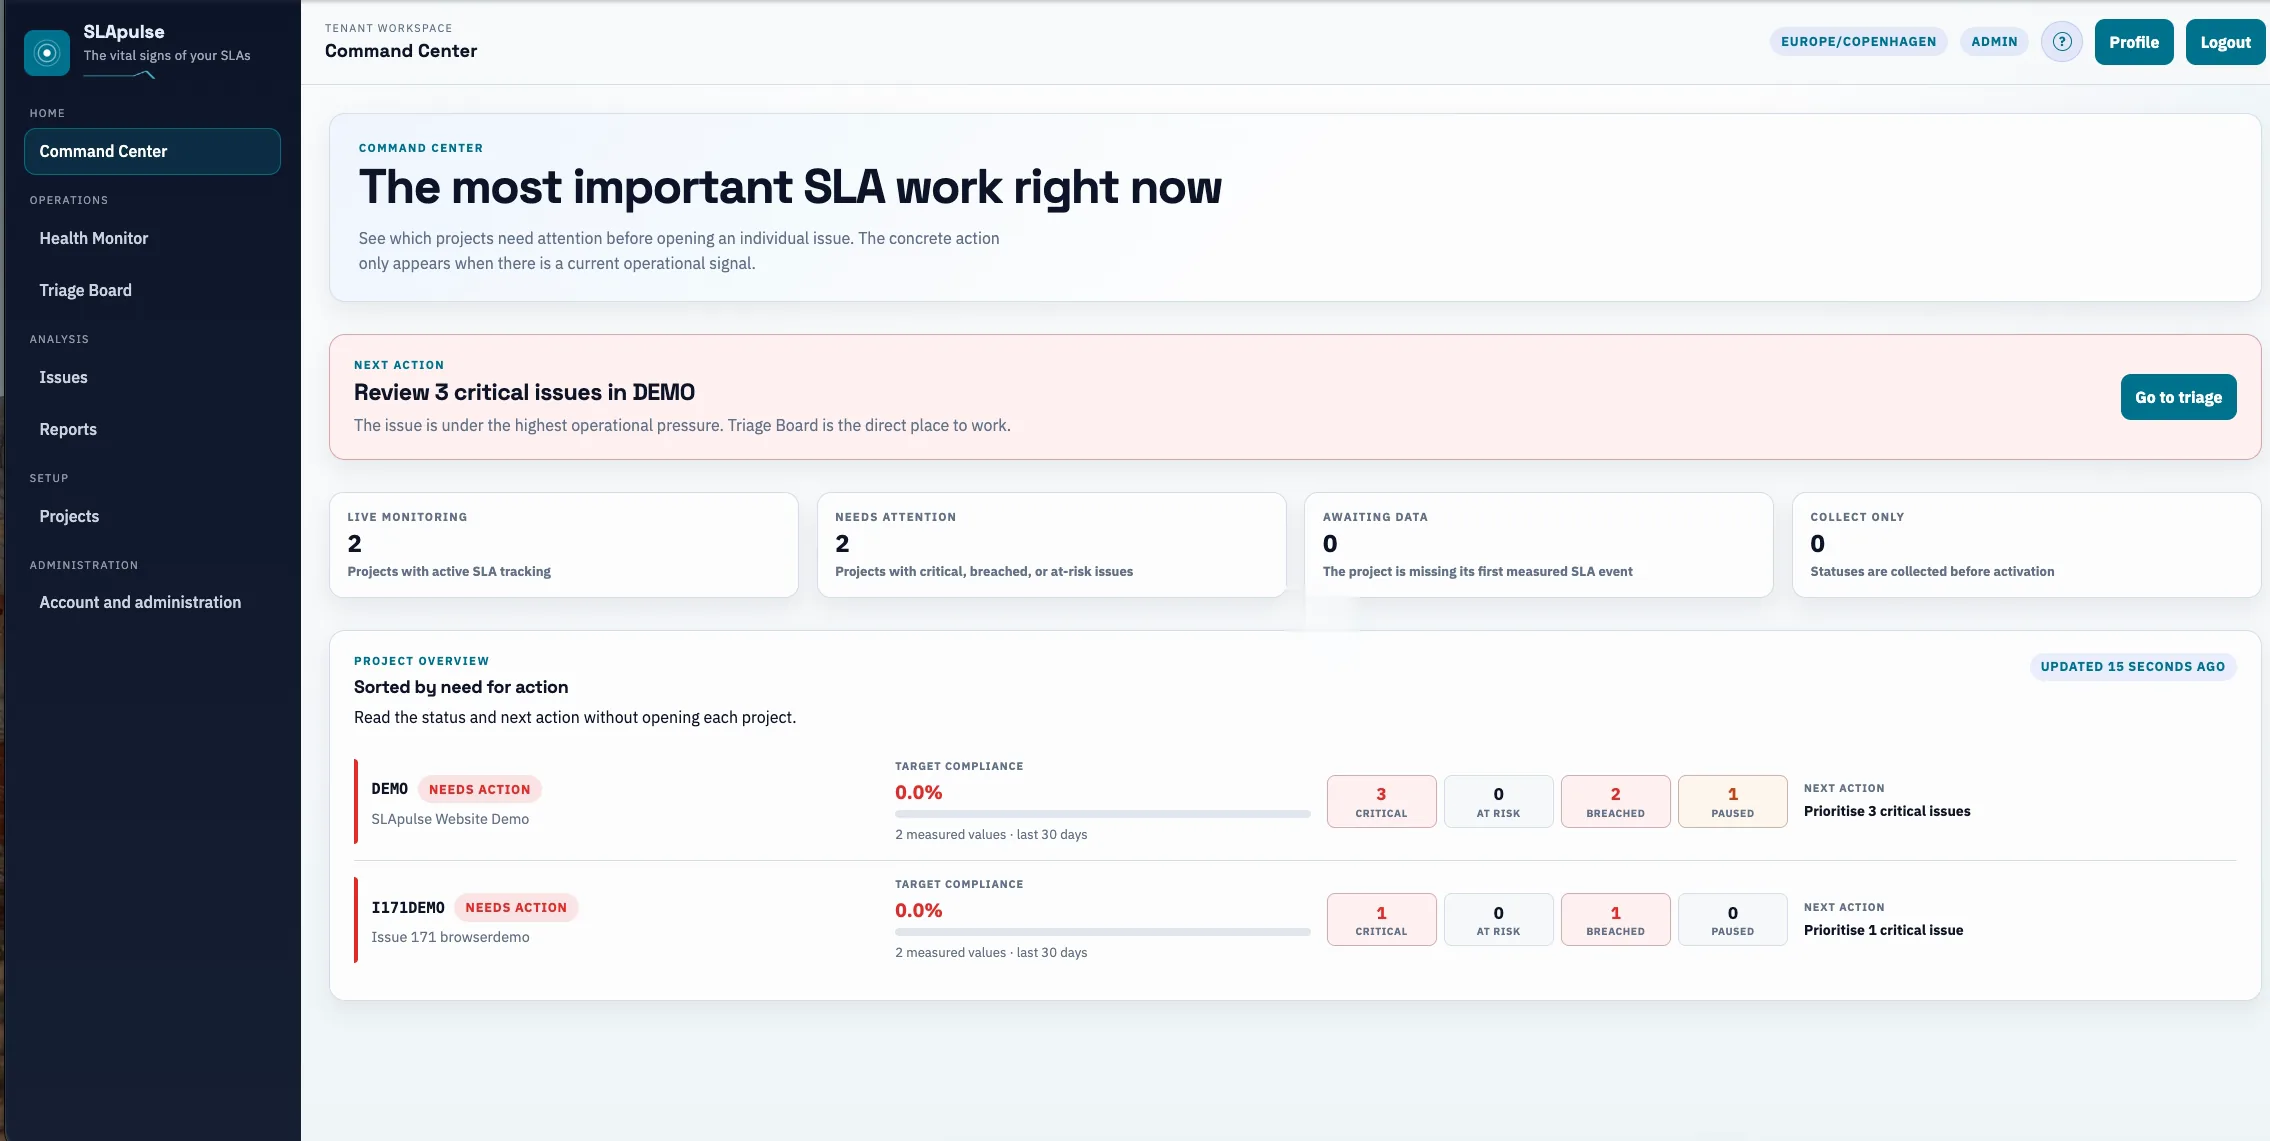
SLApulse Command Center showing the fictional DEMO project card, readiness state, operational counts and next action
Screenshot from SLApulse — demo data. Command Center with the fictional DEMO project.
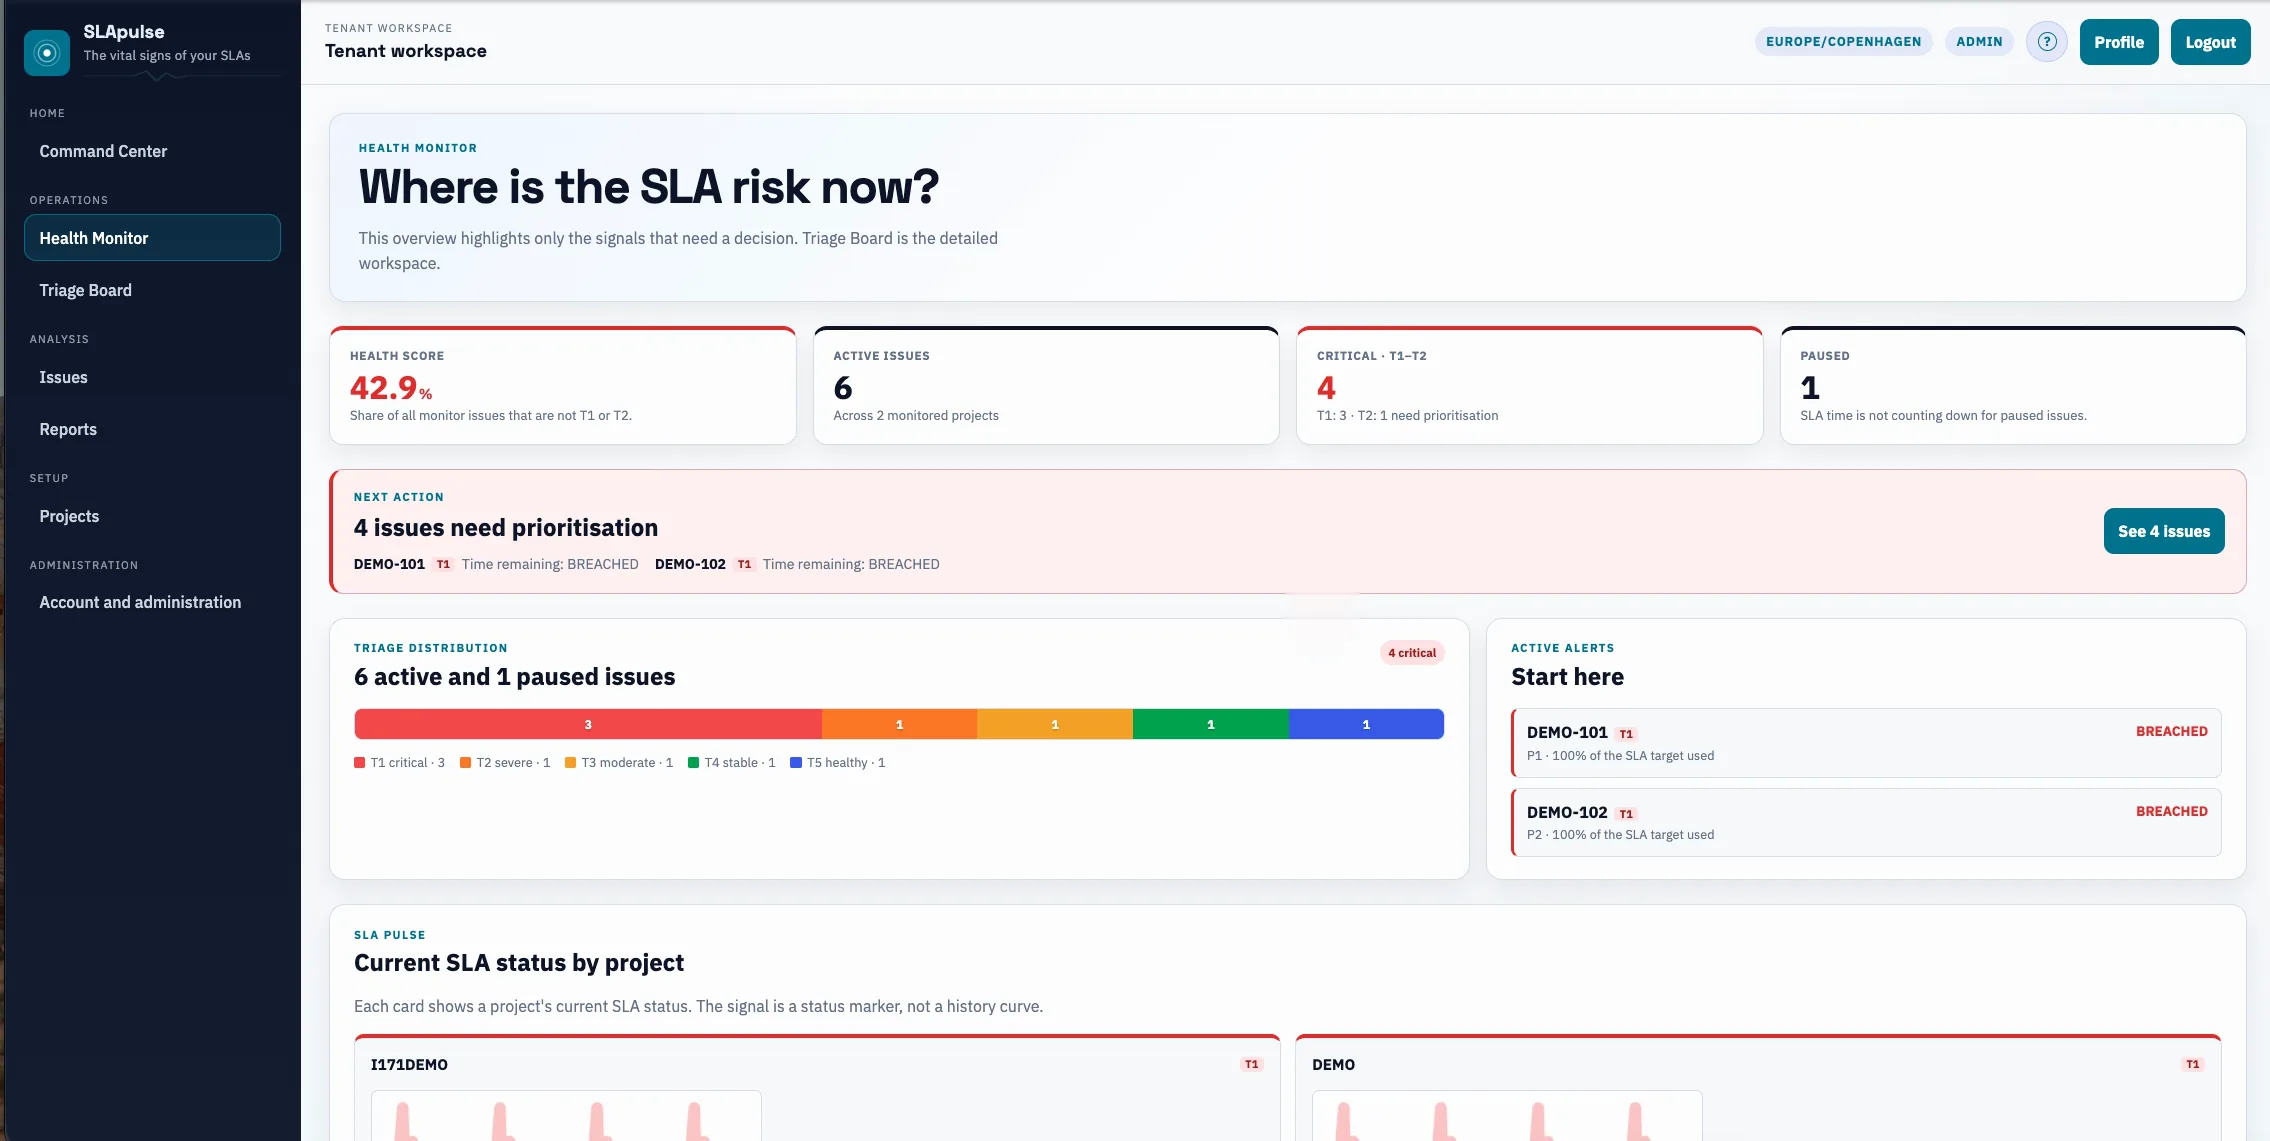
2 · Check the live picture

Health Monitor

What you see
Health score, active issues, critical count, triage distribution, alerts and a project heartbeat card.
Decision it supports
See whether SLA pressure is stable or needs a closer look before it becomes critical.
Use it when
You run an operational check and need a current picture across active work.
SLApulse Health Monitor with health score, active issues, triage distribution and the fictional DEMO project
Screenshot from SLApulse — demo data. Health Monitor with current SLA health.
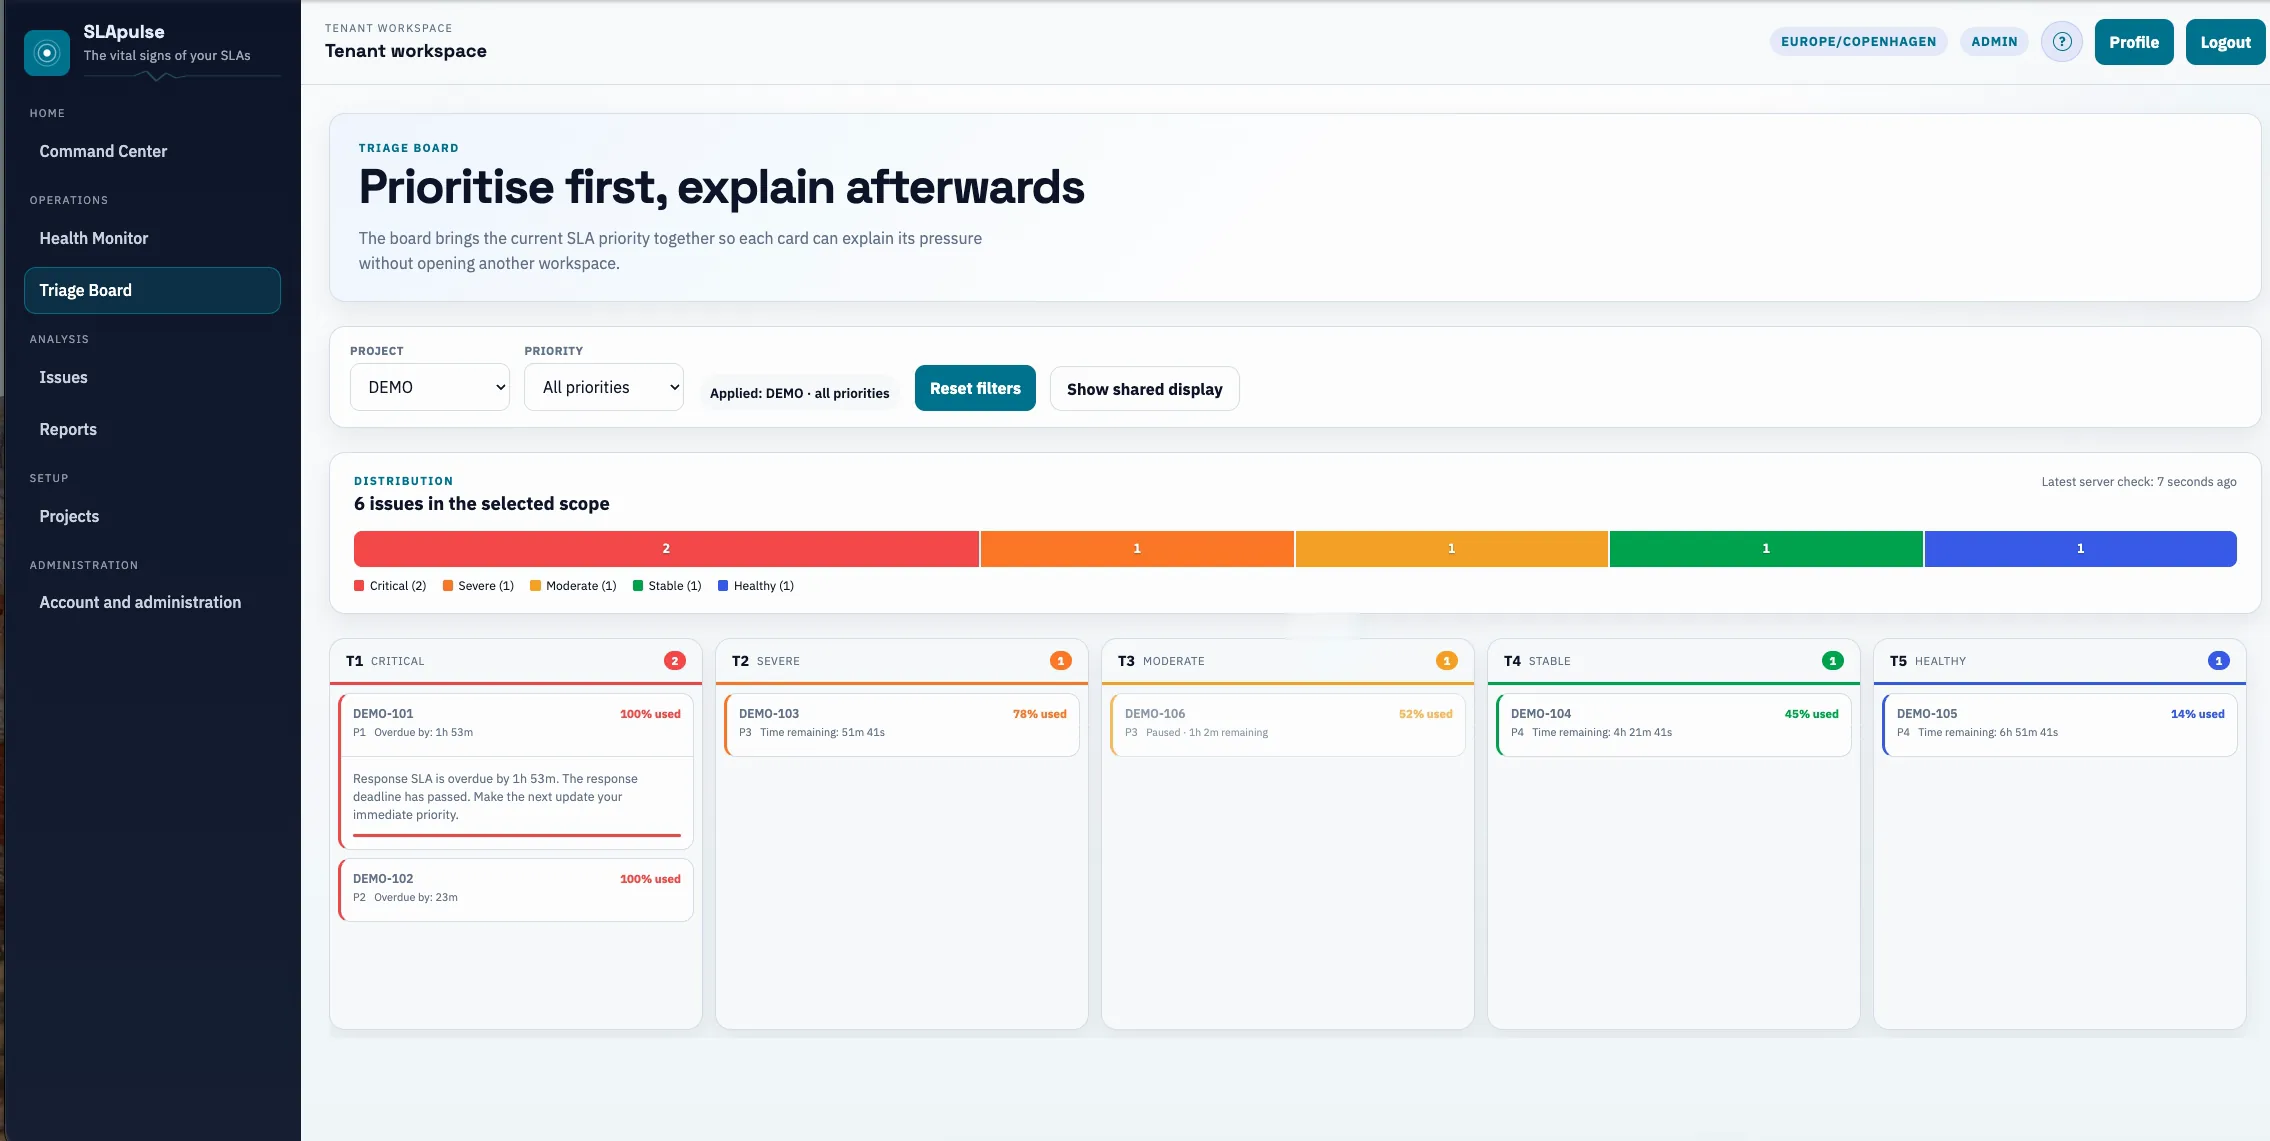
3 · Work the queue

Triage Board

What you see
The normal interactive board, filtered to DEMO, with fictional issue cards grouped across T1–T5.
Decision it supports
Choose which SLA commitment needs attention now and which work can remain under observation.
Use it when
Owners are working the active queue and need to filter by project or priority.

This is the standard Triage Board. Kiosk mode is a separate fullscreen view and is not shown here.

The normal SLApulse Triage Board filtered to the fictional DEMO project, with visible T1 to T5 issue groups
Screenshot from SLApulse — demo data. The standard Triage Board view, not kiosk mode.
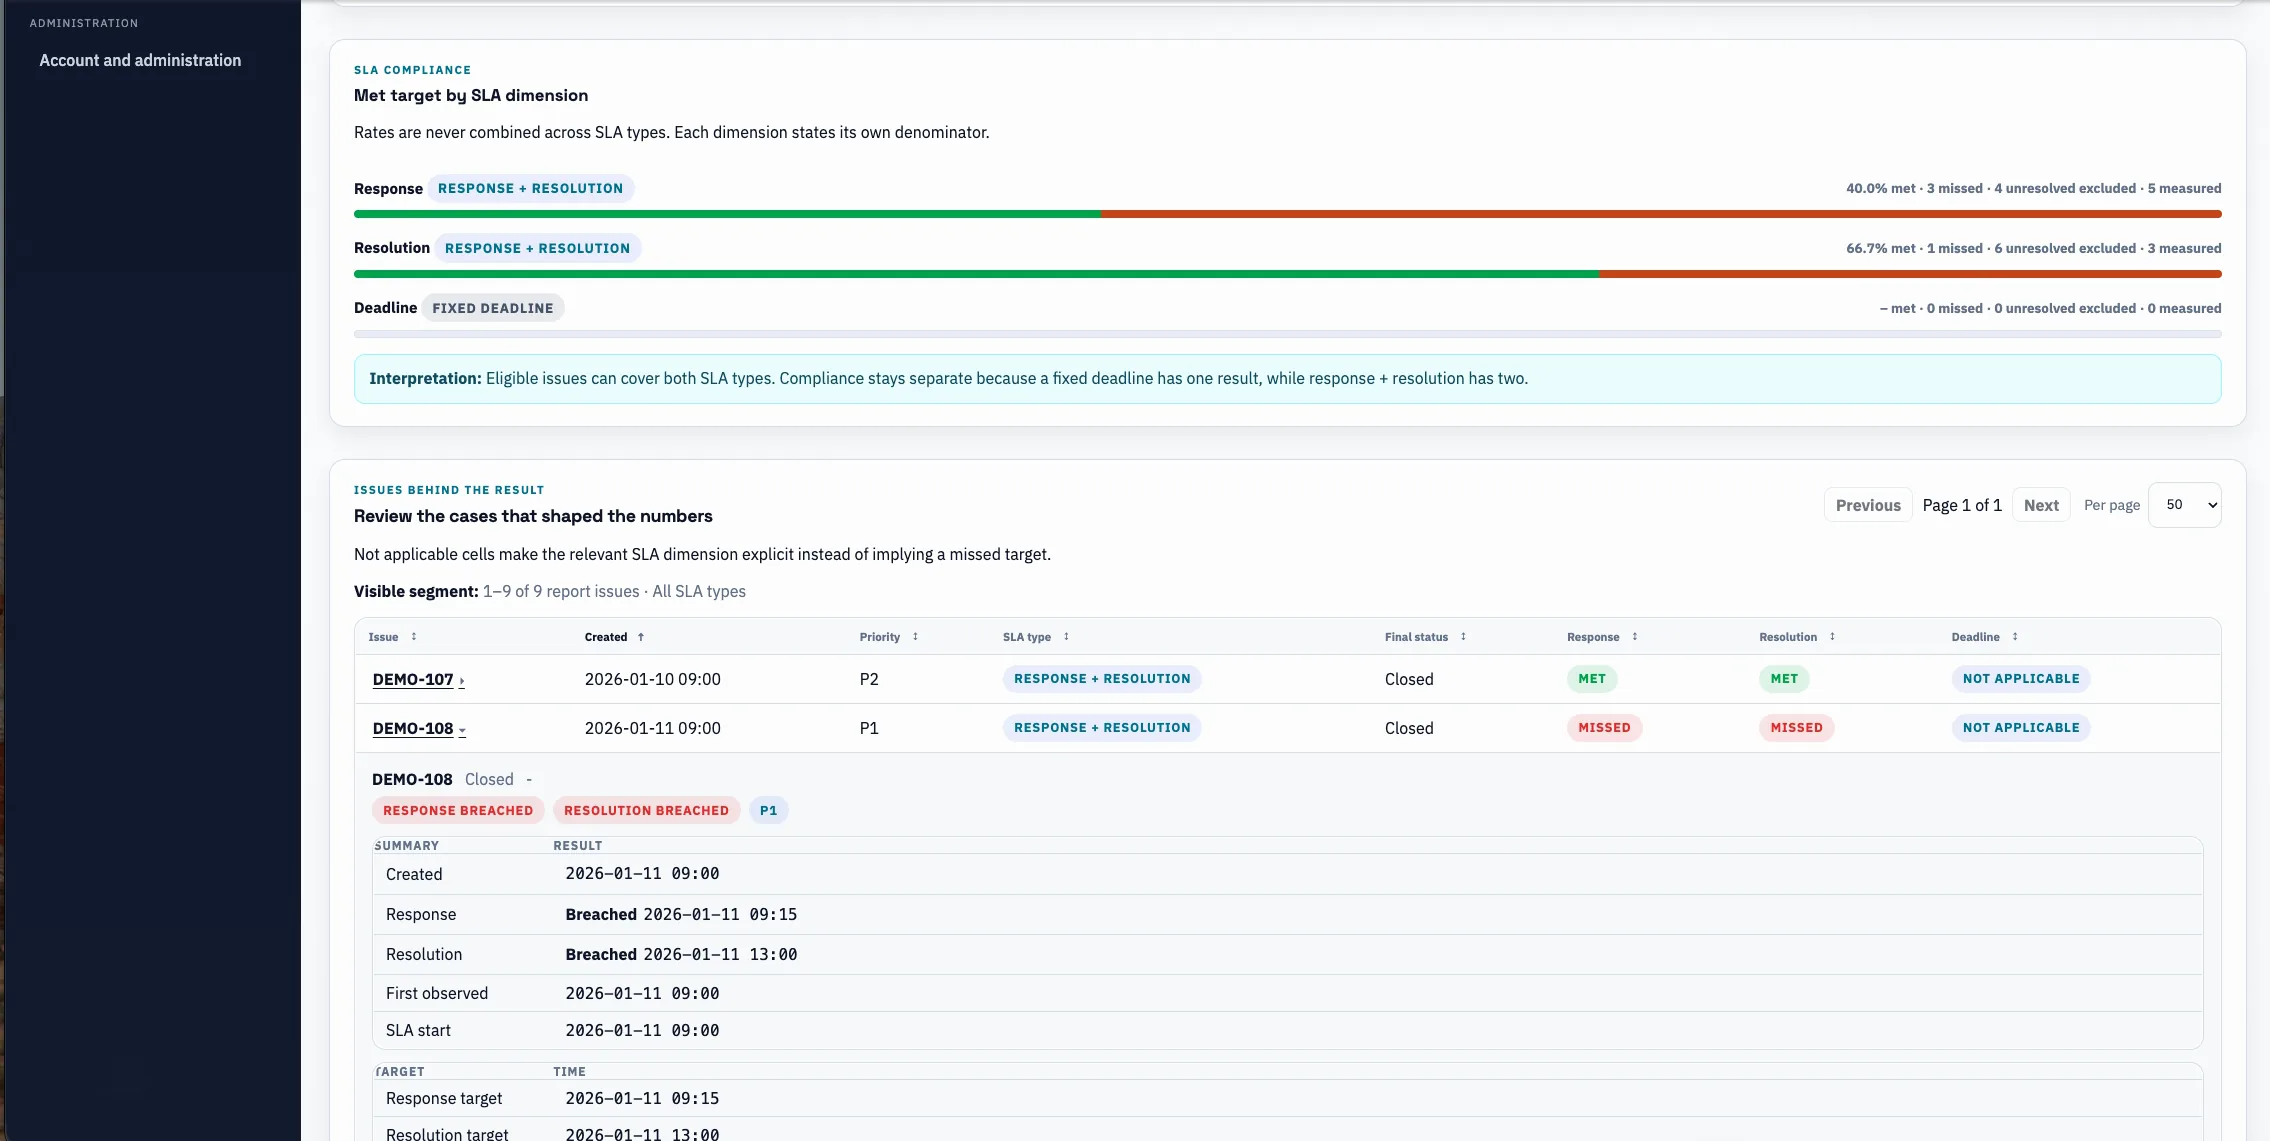
4 · Explain the result

Reports

What you see
Compliance metrics, Issues Behind The Result and one expanded SLA explanation for a fictional closed issue.
Decision it supports
Understand the outcome behind the numbers and prepare a factual follow-up or service review.
Use it when
You need to review a reporting period, explain an SLA result or export evidence.
SLApulse Reports with SLA compliance metrics, Issues Behind The Result and an expanded explanation for a fictional DEMO issue
Screenshot from SLApulse — demo data. Reports with compliance metrics and an SLA explanation.
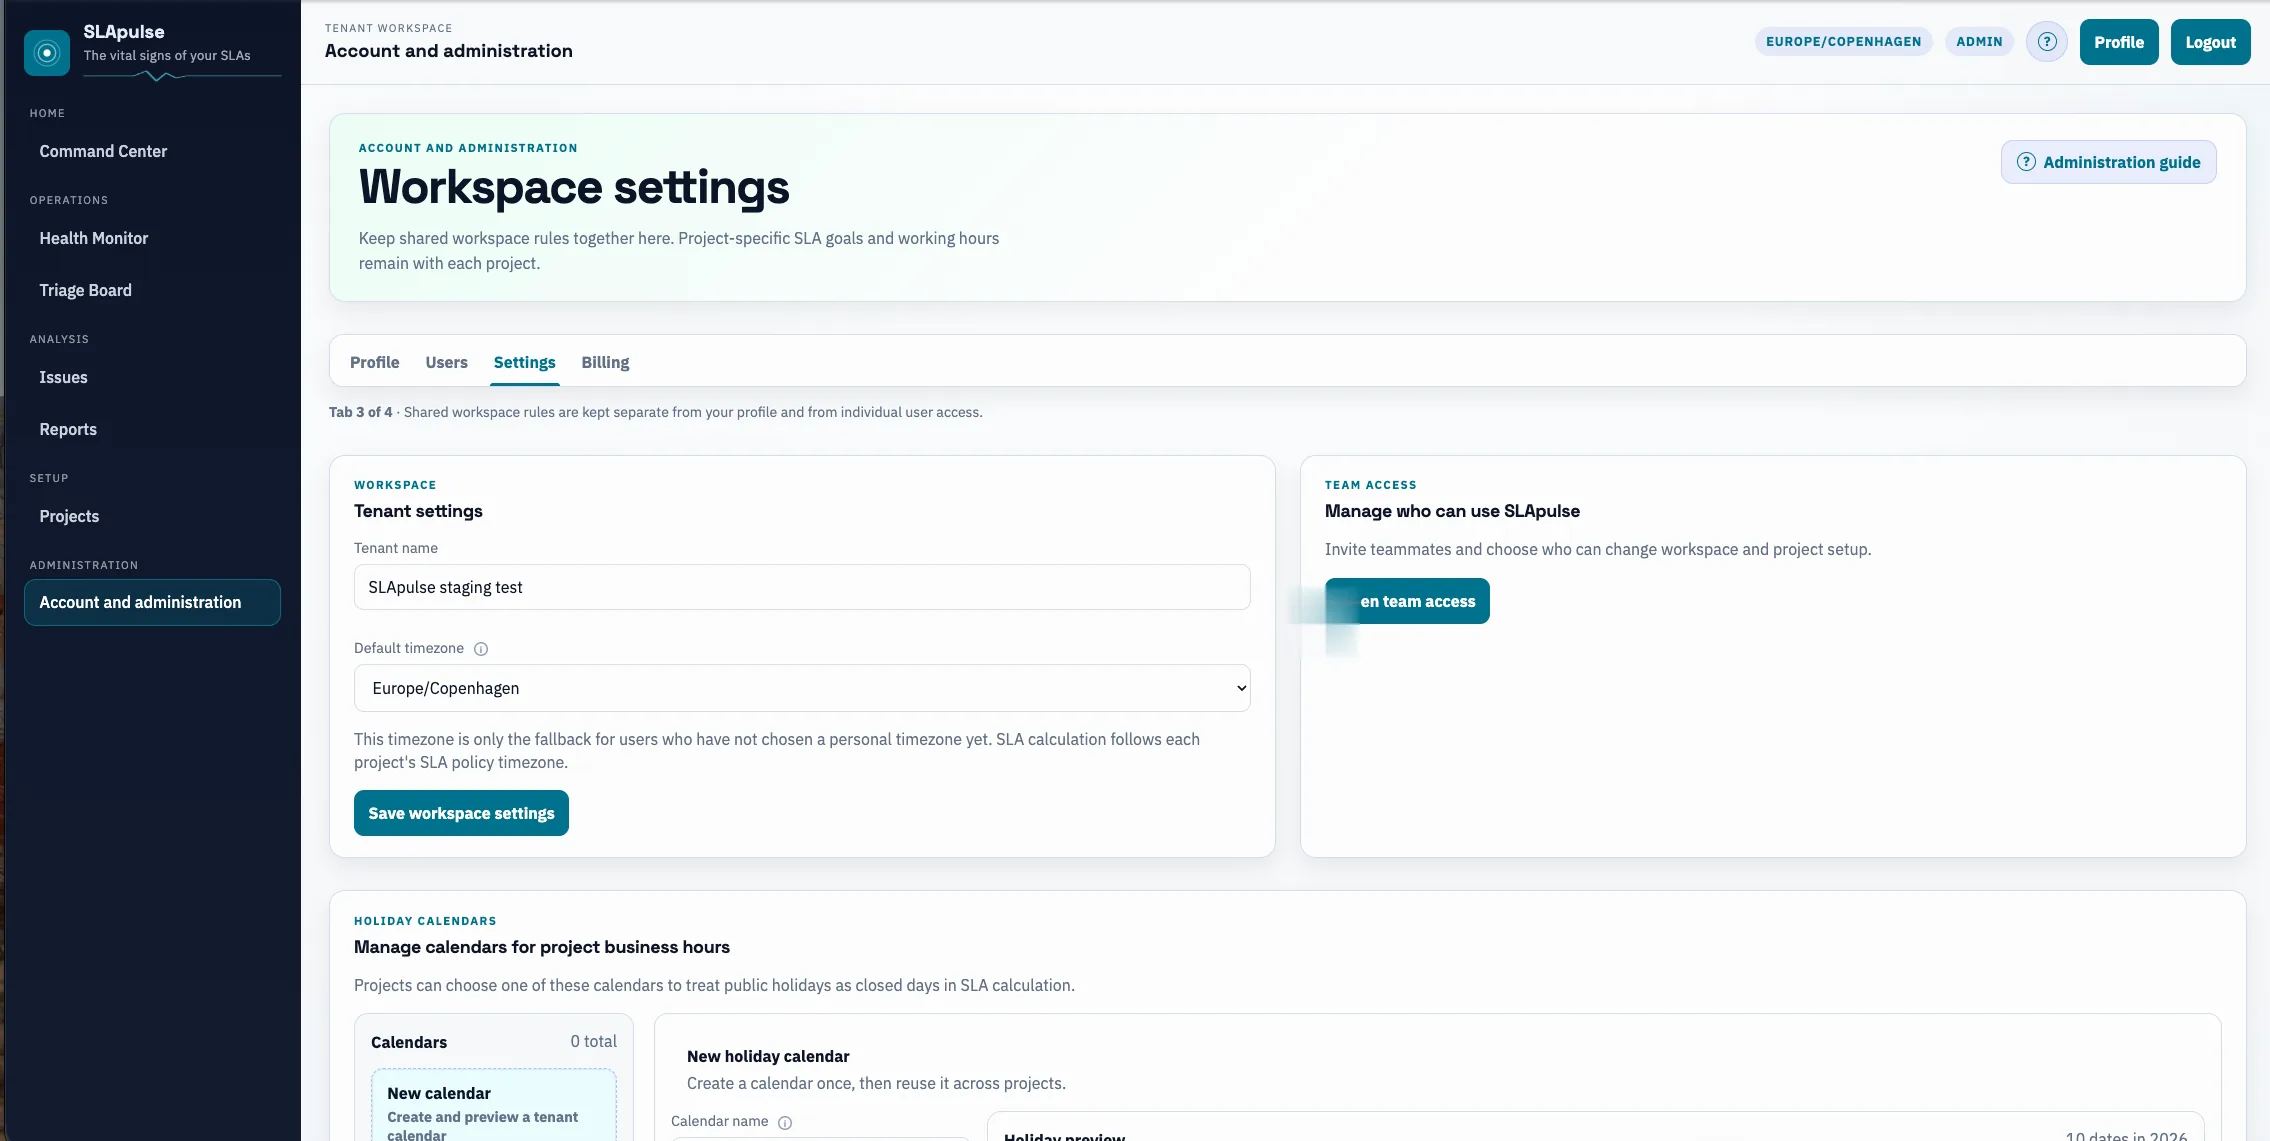
5 · Keep the workspace ready

Account administration

What you see
One account workspace for the team’s profile, users, settings and billing, shown here with workspace settings selected.
Decision it supports
Keep the people and workspace controls behind the operational views current and easy to find.
Use it when
You need to review account settings, manage access or prepare the workspace for the next operating cycle.
SLApulse Account administration with the Settings tab selected and shared workspace controls visible
Screenshot from SLApulse — demo data. Account administration with workspace settings selected.

Urgency your team can act on

SLApulse turns SLA math into visible working states, so the next action is easier to choose.

T1

Resuscitation

The most time-sensitive SLAs. These need immediate owner attention before the commitment fails.

T2

Emergency

Severe deterioration with enough time to reassign, respond, or clear a workflow blocker.

T3

Urgent

Work that is not yet critical, but has consumed enough SLA budget to deserve active monitoring.

BH

One policy, local view

Each project’s shared SLA clock follows its SLA policy: configured timezone, working hours, holidays, and workflow states. Every teammate can read times in a personal display timezone without changing that calculation.

EX

Explainability

Issue detail can show why an SLA is met, missed, paused, or still running based on timeline and rules.

IO

Exports

CSV and XLSX exports give teams usable evidence for service reviews, customer reporting, and operational improvement.

Connect issue events. Keep your workflow and data boundary.

GDPR by design: supported Jira Cloud and generic webhook flows retain only the operational identifiers, controlled status, priority and type codes, and timestamps needed for SLA monitoring. Extra payload fields are discarded before storage.

Native, direct connection

Jira Cloud

Connect Jira Cloud with a site URL, email, and API token. Import issue history, receive ongoing webhook updates, and calculate SLA state from real workflow movement.

Supported open connection

Generic webhooks

Other issue systems that can send the required issue events can use a supported generic webhook. The shared event structure keeps the SLA layer independent of a single tracker.

Setup controls

Policies and overrides

Define SLA policies, workflow mappings, project overrides, notification settings, users, and billing from the workspace.

Read GDPR & data boundaries

Run your next SLA review from live vital signs.

Start a 14-day trial and evaluate the complete ICU workflow.

Start Free Trial